Vicon Motus 10
Vicon Motus 10 (formerly known as
Peak Motus, see History of Motus) offers processing of kinematic data for a wide variety of applications.
It is easy enough to use in basic teaching applications, yet accurate and powerful
enough for complex research.
Click here to learn more about the benefits of Vicon Motus 10!
Digitizing
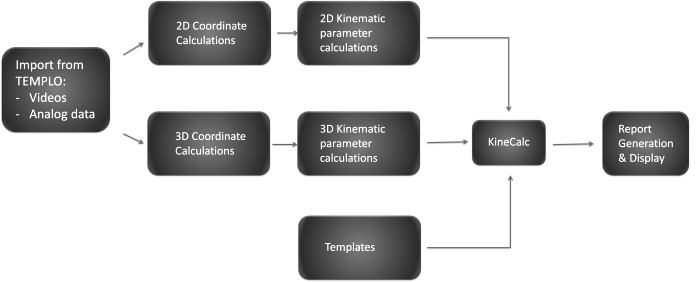
After importing videos and analog data from TEMPLO, Motus 10 offers you
multiple options for digitizing kinematic data:
- Manual: If you are unable to use reflective or black markers or have less
than optimal lighting conditions, you can still obtain accurate data by manually
digitizing - simply click on the points one at a time throughout the video sequence.
Zoom windows, predictive location algorithms and segment length options assist you.
- Automatic Tracking: Using reflective or black markers that contrast with
the background speeds up the point identification process by allowing the software
to track markers with little or no user intervention. Software adjustments can be
made to enhance the image quality and contrast to help marker tracking in a variety
of lighting conditions.
- Pattern Tracking: No markers. No manual digitizing. If you can choose a
distinguishable pattern that is visible across several frames, the software can
recognize a point within the pattern and track it throughout the video sequence.
This is especially helpful in situations where solid, contrasting markers cannot
be used.
Post-Processing
Once the coordinate data are captured they are ready for post-processing.
- Generate 2D and 3D scaled coordinates
- filter kinematic parameters
- calculate linear and angular displacements, velocities, and accelerations
- write your own advanced calculations using the powerful KineCalc module

If your research involves gait analysis, a standard template can generate not only
gait kinematics, but also lower extremity joint kinetics (forces, moments, and powers).
All of these data can then be easily displayed in animated reports that include
synchronized video clips, line graphs, bar graphs, and text.